
Showing posts with label Education policy. Show all posts
Showing posts with label Education policy. Show all posts
10.27.2022
Democrat Education Policies DAMAGE Kids – VOTE NO FOR DEMOCRAT JENA NELSON for State Superintenden

9.03.2015
Why The ACT?

As many of our readers know, ROPE has not been supportive of state-sponsored ACT use. We believe ACT is a private-market test (no matter how the company would like to sell it) and parents and students should determine when to take it - even if they should take it at all.
Recently, State Superintendent Hofmeister made it possible for all Oklahoma 11th graders to take the ACT should they choose to do so (it is a voluntary action via school district). This was after the state legislature chose not to act on an end of year ACT exam last session.
This has left the question of "Why the ACT?" Why is it SO important to have Oklahoma students take the ACT? We're told it's because, as Mrs. Hofmeister has said numerous times, "Oklahoma is an ACT state", meaning (we infer) that the majority of students take the ACT and the majority of Colleges/Universities here in Oklahoma consider the results of the ACT for admissions.
 Unfortunately, it's rarely noted that both OU and OSU start with grade point average and class position as their first necessity for admissions - NOT the ACT. Both OU and OSU take SAT as well as ACT. So if that's not what makes us an "ACT state", what does? Is it the fact that the ACT is sold most often to parents/students here in Oklahoma? What difference is that other than the result of a good marketing strategy?
Recently, the National PTA placed an article on its website called "Ten "Must Know" Facts About Educational Testing". Here, the PTA covers common misconceptions and provides information on various different types of testing. Number 7 was interesting, so I have pasted it below. Please remember, as you read this, that the Oklahoma PTA has been one of the staunch supporters of the ACT.
 |
| List of organizations in Oklahoma supporting the use of taxpayer funded ACT |
Fact 7:Even though only about 25 percent of a student's success in college is related to the student's score on aptitude tests such as the ACT and SAT, parents should (1) still help their children prepare for those tests, but (2) avoid conveying a negative impression to a child whose test scores are not particularly high. The research evidence on this point is quite conclusive.
There are many factors far more influential than aptitude-test scores in predicting a student's college performance. A student's motivation, study habits, and interpersonal skills play powerful roles in shaping collegiate success. Parents should not think that a child who doesn't earn super scores on a college admissions test is destined for failure—in college or beyond. Numerous students who earn lofty scores on the SAT or ACT take an academic tumble when they get into college. There are many important kinds of intelligence, and the "academic" intelligence measured by most standardized aptitude tests is only one.
Action Implication:
First, if your child doesn't score well on the ACT or SAT, do not conclude that your child is "not bright." And definitely do not convey any such negative impression to your child. Second, because ACT and SAT scores do, in fact, play a significant part in current college admissions decisions, be sure to provide your child with at least some preparation for those tests
"...but even if you think your test results don't reflect your grades and courses, your classroom achievements and dedication will overcome a poor test showing."So why do we need to pay kids to take this test again?
Could it be then, that the reason why ACT is so heavily lobbying for Oklahoma to make ACT a 'state' test - and why the education establishment is kowtowing to this sales job - is because of the fact that everyone involved here will get a big fat chunk of data from every kid who takes the test? Yes, I think so. Data is power. As Arne Duncan so famously said, "Data drives decisions", and of course, the Oklahoma education establishment bought this idea hook, line and sinker. Yes, if we make ACT a 'state' test, the state will get a big fat package of student data and so will ACT.
ACT has its own entire division for data collection. Test takers have a supplemental data form they can fill out at the beginning of the test. ACT analyses this information in order to assist student placement in the best choices for them following graduation (college, trade school, etc.). They also have an entire division devoted to collecting data based upon test responses which then allows them to make 'predictions' about the body of test takers and their preparedness in each of the tested subjects. They also use this data to 'verify' assumptions about the validity of the test.
What in the world could state and federal governments do with these data but go on to create yet more - expensive and invasive - changes to the public education system, including more testing? In other words, education policy arises from data collected from tests that are then used to define education policy! It's a self-inflicted wound - a closed loop system.
Just recently, ACT released the data collected from students who took the ACT last year in their annual report. Though the Common Core panacea was supposed to have been instituted in states in 2010, the headline of the entire multi-page annual report would have to be,
"...based on data from a record 1.9 million ACT-tested students - nearly 60% of the 2015 US graduating class - shows very little change in overall college readiness over the past several years."Interestingly, the SAT has very similar results to report,
 |
| Source: College Board, Created by infogr.am for EdWeek |
Apparently, all the new federally subsidized and 'suggested' education fads aren't working. What else could these results underscore other than the COMPLETE AND TOTAL FAILURE OF TODAY'S EDUCATION REFORM POLICIES? Apparently, the constant testing pummeling students today in the name of education accountability isn't helping anyone but the bottom line of the testing companies. It's SURELY and OBVIOUSLY not helping the kids. If parents want students to take college readiness tests, parents should either pay for them out of their own pockets, or apply to ACT for a grant to do so. States should not be using hard-earned tax dollars to pay for a test that - at best gives them an idea of what they do and don't know - they should be using those tax dollars to support great teachers and TRADITIONAL educational methods that have been shown to work for decades.
2.11.2014
The Oklahoma Chamber of Commerce Makes "Outrageously Wrong" Claims About COMMON CORE
Recently, the Oklahoma State Chamber of Commerce produced a brochure called, "Preparing Students for Success"


Please note the blue square in the bottom of page 2 which says, "Case Study". This is a case study on Kentucky. Here, the Chamber of Commerce gives us the exciting CLAIM that Kentucky's educational scores have risen dramatically since the Common Core State Standards were fully implemented in Kentucky.
Having at least a working knowledge of statistics, I KNOW there is no way to extrapolate (let alone determine) any correlation among something as diffuse as standards (or curricula) and educational achievement on national tests in one year's time. There are simply too many moving parts - too many outside factors involved - to be able to attribute any increase (or decrease for that matter) of testing scores to a change in standards made across an entire K-12 system in one year. Without a degree in statistics (knowing what happened to the OU statisticians who critiqued Oklahoma's A-F system) I felt unable to address this claim outright.After just one year, the percentage of Kentucky students graduating college and career ready increased from 34 percent to 47%, and for the first time, the state scored above the national average on national tests, including the ACT.
After hearing this brochure was being handed out to legislators at the Capitol, however, I decided to do some research on the Chamber of Commerce claims, so I called Richard Innes, Education Analyst at the Bluegrass Institute in Kentucky. Richard is also a member of Truth in American Education - an organization for which ROPE is a contributor.
Richard wrote me the following email to share widely. He is NOT happy about the claims made by the Oklahoma Chamber of Commerce (and, coincidentally, Stand For Children).
Mr. Innes writes:
Jenni,
For starters, the chamber's assertion about testing results -- that Kentucky scored above the national average on the ACT -- is absolutely false! In fact, this claim is outrageously wrong.

The 2013 ACT results for all states are readily available here: http://act.org/newsroom/data/2013/states.html
Kentucky's ACT Composite Score in 2013 was 19.6. The national average was 20.9.
You have access to the NAEP maps to discuss the claim that Kentucky outscored the nation relative to that assessment, and I have more on NAEP below, as well.
Next, the chamber's pamphlet also contains significant errors about Kentucky's College and/or Career Ready statistics (CCR). The CCR rate didn't increase from 34% to 47% in one year.
Here are the actual Kentucky CCR rates by year:
Kentucky's College and/or Career Ready Rates, by Year
CCR_2010
|
CCR_2011
|
CCR_2012
|
CCR_2013
|
34
|
38
|
47.2
|
54.1
|
Data Source: Excel Spreadsheet on CCR in the Kentucky School Report Cards web site (http://applications.education.ky.gov/src/DataSets.aspx). Go to the web address and click on "CCR" under the "Delivery Targets" section. Next, open the Excel spreadsheet and scroll all the way down to the state data at the bottom. The second to last line shows the actual statewide CCR "scores" which really are the percentages.
The one-year increase from 2012 to 2013 was only 6.9 points!
I am still researching the real implications of the numbers in the table above. At this point I suspect that the growth in 2012 and 2013 is notably due to changes in the state accountability system that started in the 2011-12 school year, including CCR as an accountability element for the first time and creating a number of new ways students could be counted in the success column.
Here the different ways a student can be listed as college and/or career ready:
The College Ready indicator includes graduates who met the Kentucky Council on Postsecondary Education (CPE) system wide Benchmarks for Reading (20), English (18), and Mathematics (19) on any administration of the ACT. Students also are counted college ready if they passed a college placement test (Compass or The Kentucky Online Testing (KYOTE) placement testing system).
The Career Ready indicator includes graduates who met benchmarks for Career Ready Academic (ASVAB or ACT WorkKeys) and Career Ready Technical (Passed the KY Occupational Skills Standards Assessment [KOSSA] or received an Industry-Recognized Career Certificate). Students must pass an element in both areas, academic and technical, to be counted as career ready.
Source: Kentucky School Report Card, State, “Accountability – College and Career Readiness (CCR), from PDF version, Page 36.
The key here is that Kentucky schools probably are still adjusting to the fact that they can qualify students as either college or career ready in more than one way. Some, perhaps a great deal, of the growth in the CCR numbers might be due to more students having the opportunity to take the alternate readiness elements that were not formerly used for accountability and may not have been widely available to students before accountability began. At this point, I cannot say for sure.
What I do know is that the growth in CCR between 2010 and 2013 shown in the table above is not reflected in any notable increase in performance on the ACT college entrance test in Kentucky.
Throughout the period from 2010 to 2013, all Kentucky public school students have taken the ACT. Unfortunately, the public school Benchmark results have not been consistently reported over this four-year period because Kentucky switched from using ACT's own Benchmark scores to using different Benchmark Scores set by the Kentucky Council on Postsecondary Education (CPE).
However, here are the percentages of all Kentucky students, public and private combined, who have achieved the ACT Benchmark Scores by year. Because private school enrollment in Kentucky is fairly low, the numbers largely reflect the trend for the public schools only.
ACT Performance for Kentucky by Year, All Students Public & Private, Percent of Students Reaching ACT Benchmarks
Year
|
English
|
Math
|
Reading
|
Science
|
2010
|
55
|
28
|
40
|
21
|
2011
|
57
|
28
|
43
|
21
|
2012
|
59
|
31
|
44
|
22
|
2013
|
57
|
30
|
36
|
28
|
As you can see, there have been no remarkable changes in Kentucky over this four-year period. Reading performance actually dropped in 2013 and science jumped up a bit, but that may be because ACT reset benchmark thresholds for those subjects in 2013. If the reading Benchmark score had not changed, I calculate the percentage reaching the old benchmark in 2013 would be 44, unchanged from the 2012 level. In science, the 2013 percentage would be 23 percent, little different from previous years, as well.
However, the main point is there has been no notable jump in Kentucky for college readiness based on the ACT.
So, there is evidence that the CCR improvement is mostly due to other factors that can lead to a student succeeding in meeting one of the various CCR criteria.
Another point: I led you to the Bluegrass institute's blog (www.bipps.org/blog). We have a large number of posts about Kentucky's true educational performance there, including discussions about why you must look at scores disaggregated by race to begin to properly rank Kentucky against other states. That is true whether we use the National Assessment of Educational Progress (NAEP) or the ACT (only possible for those states that also test around 100% of their students with this college entrance test).
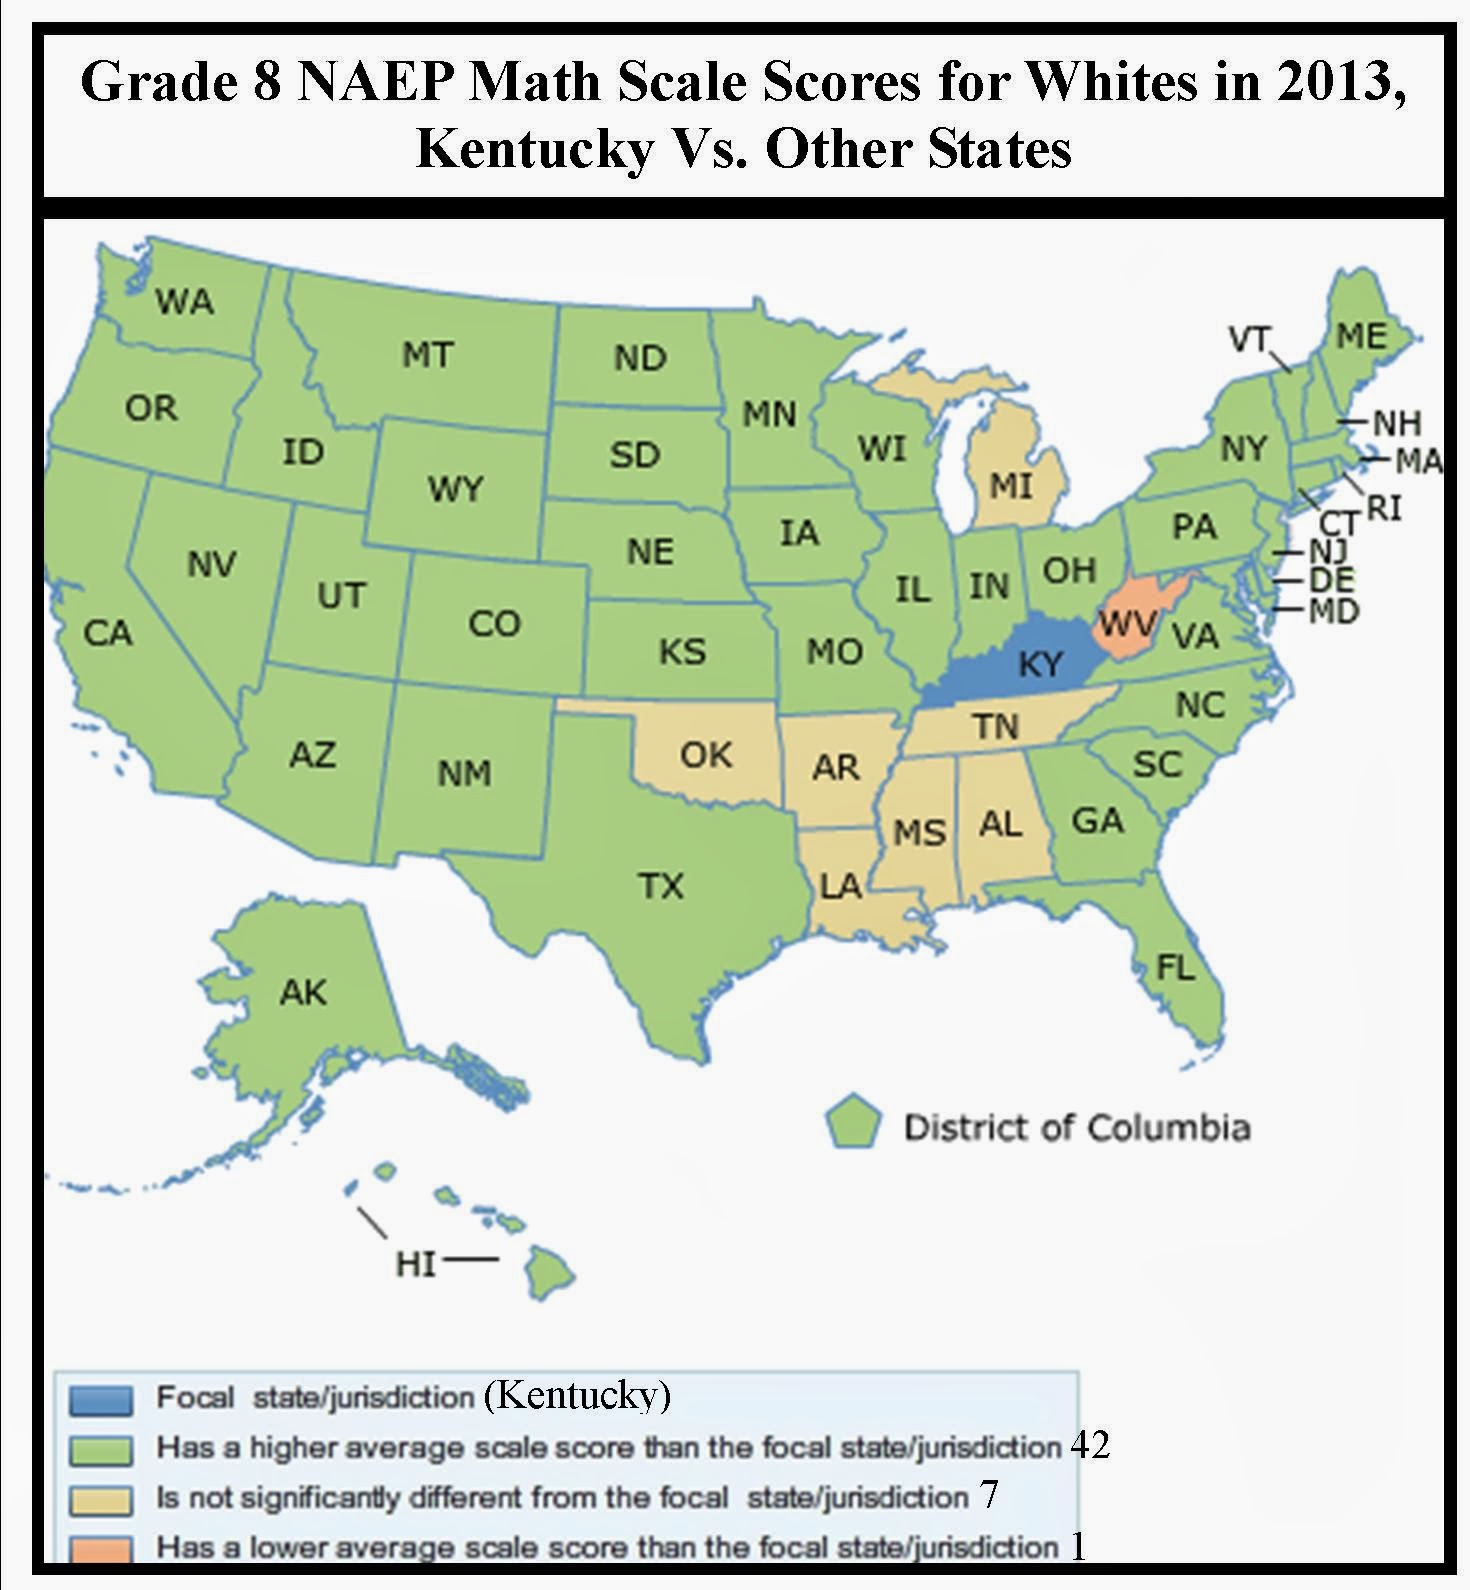
Whites in all the states in green got math scores statistically significantly higher than Kentucky's whites did in 2013. The seven states in tan tied us and only one state, West Virginia, did statistically significantly worse. That's all -- just one state. Is this a target for Oklahoma?
There are more maps like this for Grade 8 reading and for 4th grade math and reading in the Bluegrass Policy Blog.
Let me discuss another example. This is for Southern States that test 100 percent of their students on the ACT.

(If you cannot enlarge this with your e-mail reader, you can find this table here:
http://www.bipps.org/act-scores-are-out-how-does-kentucky-compare-to-other-southern-states/)
Notice that Louisiana scored 0.1 point lower than Kentucky when you look at overall scores. However, when you break the data out by race, Louisiana outscored Kentucky for every single racial group and clearly has a somewhat stronger education system. However, this truth is buried in the overall average scores.
So, what happened to that overall score?
The answer is something that even has a name, Simpson's Paradox. It is a hazard in working with averaged data when the underlying student demographics vary dramatically.
Because of the achievement gaps for all the minorities, a state like Kentucky with a very large white population gets an unfair advantage in any simplistic comparison of only overall average scores. This is very important to understand when others point to things like Kentucky's supposedly high ranking in the latest Quality Counts report from Education Week. Quality Counts is largely a popularity contest for current education fad ideas, but it also includes some NAEP scores. However, with one small exception, Quality Counts only looks at overall average scores. They thus trip all over Simpson's Paradox.
In closing, the jury is still very much out on Kentucky's real education performance since CCSS came along, but there already is a disturbing amount of evidence that much of the hoopla about Kentucky's supposed improvement is not on target.
For sure, almost every claim about Kentucky in the Chamber's pamphlet is absolutely incorrect. I would love to know who fed them this nonsense.
http://www.bipps.org/act-scores-are-out-how-does-kentucky-compare-to-other-southern-states/)
Notice that Louisiana scored 0.1 point lower than Kentucky when you look at overall scores. However, when you break the data out by race, Louisiana outscored Kentucky for every single racial group and clearly has a somewhat stronger education system. However, this truth is buried in the overall average scores.
So, what happened to that overall score?
The answer is something that even has a name, Simpson's Paradox. It is a hazard in working with averaged data when the underlying student demographics vary dramatically.
Because of the achievement gaps for all the minorities, a state like Kentucky with a very large white population gets an unfair advantage in any simplistic comparison of only overall average scores. This is very important to understand when others point to things like Kentucky's supposedly high ranking in the latest Quality Counts report from Education Week. Quality Counts is largely a popularity contest for current education fad ideas, but it also includes some NAEP scores. However, with one small exception, Quality Counts only looks at overall average scores. They thus trip all over Simpson's Paradox.
In closing, the jury is still very much out on Kentucky's real education performance since CCSS came along, but there already is a disturbing amount of evidence that much of the hoopla about Kentucky's supposed improvement is not on target.
For sure, almost every claim about Kentucky in the Chamber's pamphlet is absolutely incorrect. I would love to know who fed them this nonsense.

Richard Innes
Staff Education Analyst
Staff Education Analyst
Bluegrass Institute
Office: 859-344-0406
Cell: 859-466-8198
So, if the Chamber of Commerce (and Stand For Children) is WRONG about Kentucky? What else are they patently wrong about when discussing Common Core?
Office: 859-344-0406
Cell: 859-466-8198
So, if the Chamber of Commerce (and Stand For Children) is WRONG about Kentucky? What else are they patently wrong about when discussing Common Core?
Subscribe to:
Posts (Atom)