Showing posts with label NAEP. Show all posts

9.21.2014

Leaders And Laggers And Bears - OH MY!


Well, it was so nice to see the national Chamber of Commerce reverse its view of public education as failing in its new Leaders and Laggers report. Oh, what? They didn't? 

Godness, maybe I'd better study this more in depth to find out why Oklahoma is failing so badly. In order to do this, however, we have to go to the sources cited by the study. All the information below has been taken from the NAEP State Profiles site.

Let's look at Oklahoma's report:


Wow. Oklahoma's public education is in the dumper, clearly. 

In fact, our now-deposed State Superintendent, Dr. Janet Barresi claimed the following in her statement, provided upon the release of the report,
"We must not defer to mediocrity. This report is more evidence that PASS fails."
But, is that actually the case? Let's look more closely at the report. Please note, there is a drop down menu on every line that has an arrow. Should we zoom in?


Now, please look closely at the stats presented here. 

Does anyone but me notice that since 1992, 4th grade mathematics scores have been IMPROVING STEADILY? Please also make note that these improvements mirror NATIONAL improvements and these data were accumulated PRE-COMMON CORE - using PASS. Not only that but our number of students in the ADVANCED category has increased from 3% to 5% in 2 years. Not only that, but Oklahoma has higher or equal scores to 20 other states. That achievement gets an "F"? RIDICULOUS.

Clearly 8th graders are not seeing the gains made by 4th graders, however, and again, 8th grade mathematics scores have been right in line with national scores or IMPROVING steadily over the years (BEFORE Common Core - under PASS) until last year, when there was a downturn. In addition, it is true that these scores are lower than those of 42 states/jurisdictions. Shouldn't we be using this data as a basis to determine why the significant gap in performance from 4th to 8th grade instead of using them as a club to berate the state into passing legislation to further drown schools in time/money sucking mandates to ostensibly fix a problem, the cause of which no one has even identified yet?


First of all, whatever instruction Oklahoma was touting from 1992 to 1998 should be re-utilized. The scores for 4th graders during that time were absolutely outstanding! The regression in scores from 1998 to 2002 should be looked into and determined via comparison. This is the other problem with these kinds of 'reports'. There is no attempt to link existing education policy/methods with former education policy/methods when there is a deviation in scores from year to year. But then again, that would be helpful, and that is not at all the reason for this kind of issuance. 

It should be noted that though there was a clear downturn in progress from the late 90's, the trend again began to climb to the point there is NO SIGNIFICANT DIFFERENCE BETWEEN NATIONAL SCORES AND OKLAHOMA SCORES. In addition, though 2011 saw a slight decrease - the trend is unmistakably UP for 4th grade English scores and overall, Oklahoma is right in the middle of the pack. Again, That achievement gets an "F"?


Same story as 4th grade Reading nearly exactly, excepting that 8th grade scores are definitely lower in the "advanced" category, however, again, for the most part, our scores are going UP. If we were backsliding or continually stagnant, I could understand a grade of "F". There's no way continual overall improvement rates an "F". The graph below, I think, well demonstrates that notion.


Academic Achievement Low Income:
I love this one. Here, the authors break down every conceiveable ethnic group and compare that group's progress to that same group's national average. Oklahoma gets an "F" here too, but here's the funny part; look at the low income section - Oklahoma is actually ABOVE the national average in academic achievement for low income kids in BOTH reading and math. Wow. Totally see how that gets us an "F".


What about 8th grade reading and math? Well, we're completely on par in reading but well below national average for 8th grade math. Again, this deserves an "F"? More like a low B/high C. Again, this is absolutely reflective of the previously-identified trend of clear divergence in scores from 4th to 8th grade. We must identify the reason for this divergence, otherwise we'll continue to get the same results. This report is NOT helping - but then again, as I've said, helping is not the objective of these reports. The objective is to give policy makers a 'Sky Is Falling' view in order to create a crisis only solved by further legislation, further removing educational liberty from parents who are thought to be too stupid to manage the educations of their children without 'state' help.


Ok, after this part, the statistics get even fuzzier. What the heck are the rest of the categories? What do they even mean? These aren't things that can be simply looked up on the NCES website (National Center for Education Statistics), they were created via a tangled web of overlapping/interlocking research papers from various politically-subjective private foundations/organizations. Since I was unfamiliar with a way to research and digest any further failing grade categories on the list, I clicked around on the Leaders and Laggers website until I found the Technical Appendix. THAT is where all the gold can be found for this report!

This page basically identifies how all the data in the table was collected and sourced. I suggest checking out this page, as their sources are quite enlightening, as are a number of the data qualifiers. For example, under the Academic Achievement sections, the authors tell us that there is no clear bar set for proficiency while claiming that the comparisons among proficiency categories are still valid.

Parental Choice calculations are muddled at best and indecipherable at worst. I read all the information supplied for the category and still can't understand how the results were calculated or what they mean.  Data information comes from the Data Quality Campaign - a Bill Gates construct - that alone should speak volumes.

Technology calculations come from Digital Learning Now - a Jeb Bush, Foundation for Education Excellence creation. Both DQC and FEE are unapologetically Common Core proponents. How can this report claim to be unbiased using sources so clearly foundationally biased?

Though the report states,
Finally, it is important to note that this report is not designed to push a particular set of reforms or justify particular policy positions. Its purpose is to inform the debate with timely information and the opinions of groups focused on individual education policy areas (such as Digital Learning Now! (funded by Jeb Bush), the Data Quality Campaign (funded by Bill Gates, Kaiser, Buffett), the National Alliance for Public Charter Schools (funded by Bill Gates, Carnegie, Broad etc.), and the National Council on Teacher Quality (funded by Bill Gates, Carnegie etc.). As such, there are some inherent biases driven by those rankings we chose to include and those we did not. Any such ranking would be subject to this limitation.
it is important to recognize that the Council for Foreign Relations and the Center for American Progress - organizations used to provide materials for this ranking - would not be information pools from which conservatives would/should swim under any conditions. 

So, what purpose can be surmised for this document? It appears clear it will be used to further direct education policy geared to further strangle local control of the educational process. After all, if our schools are failing, it must be due to the backwoods hick parents that need constant direction by their government overseer. 

In light of this probability, I find it amusing to have read the following statement in a section that argues we must overhaul America's failing education system because her private sector is a world leader renowned for its innovation and productivity NOW;
"...current status is no indication of future superiority."
Yes, that's true. But then, that statement cuts two ways, doesn't it? Maybe we'd better learn to identify when we're being manipulated by 'reports' of this kind, call it what it is, and direct our efforts back toward discovering the real reasons for failure and correcting those. Assigning blame to energize political efforts will NEVER produce viable results.

4.28.2014

Is Common Core MEANT to Blow Up the American Educational System?


It is no secret that, for years, public education has suffered poor outcomes.  It is also no real secret as to why, yet this is rarely ever written about.

Let's start by examining ACT scores.  It is easy to see that verbal scores began to plummet during the early 1970's and never recovered.
http://professionals.collegeboard.com/profdownload/CBS%2096%20National.PDF
It's also easy to see the lack of substantial gains in reading during a similar time period according to the National Assessment of Educational Progress (NAEP) -

http://nces.ed.gov/nationsreportcard/pubs/main2008/2009479.asp
Let's think.  What was happening during the early 1970's other than bell bottoms and muttonchops?  Most probably, the falloff of something that happened in 1965 when the first Elementary and Secondary Education Act (ESEA) was signed into law by LBJ.

Because government never shrinks, the ESEA of 1965 that took up only about 30 pages in a typewritten journal and contained 'only' 605 sections, has increased to literally hundreds of electronic web pages and over 9,601 sections today.

What does this situation have to do with education 'reform'?  According to "Federal Compliance Works Against Education Policy Goals"
"...fiscal and administrative requirements often lead to expensive and time-consuming compliance processes that are not related to improving student achievement or school success."
Lindsay Burke reports in "The Dead Hand of Education Reform", that,
"...while the feds provided just 7% of education funding, they accounted for 41% of the paperwork burden imposed on the states..."  
In fact, according to a personal communication from Representative Scott Martin, the House Appropriations and Budget Chair, Oklahoma's federal Title 1 funding amounts to the figures below.
Program Title                                    FY-14 Federal Award
Title I                                                     $148,119,558
Migrant Education                                        13,204
Migrant Education                                  1,507,155
Neglected and Delinquent                      334,901
Migrant Consortium                                    60,000
Title I School Improvement                    247,691
              Total                                                      $150,282,509

And these are just dollars that go to satisfying compliance with ESEA.  What about federal funding applied for and accepted by our State Department of Education (OSDE) for various federal grants and programs - money that grows the OSDE but does not put money into classrooms?  Well, since the State Department of Education is not in compliance with the State's Sunshine Law, it is hard to report a verifiable amount, however I wrote this last year:
The day the A-F rules disapproval passed the Administrative Rules and Government Oversight Committee, Governor Fallin issued a press release supporting the rules and the SDE touted their receipt of nearly 7 million dollars in School Improvement Grants (SIG) to be used for "turning around" schools graded as 'failing' under the NCLB Waiver-prescribed A-F grading system.
Did that money go into the classroom?  No, it went to satisfy the mechanics of a program (SIG) demanded by the Obama Administration in the Waiver - one of the Four Pillars of Education reform we have outlined before.  In addition, Dr. Barresi also applied for and accepted a State Longitudinal Database grant in order to satisfy another of the Pillars.

Obviously, our state (like many in the nation) spent a lot of time writing and administrating federal grants to help subscribe to the federal government's notion of what state education should be.  So heavy handed has the federal government become in Education, that U.S. Senator Lamar Alexander recently lamented,
...the United States Department of Education has become so congested with federal mandates that it has actually become, in effect, a national school board.  States must come to Washington for approval of their plans to educate their students.
Part of this phenomena is simply 'big government creep', however, I have begun to believe this is more serious.

Though many do not like to compare Health Care Reform with Education Reform, there are several parallels:
  • Health Care Reform was a completely top down, univited usurpation of one's individual right to choose how best to medically care for themselves via a federal law full of moving parts.
  • Education Reform (Common Core, School Turnaround, Teacher-Leader Effectiveness, State Longitudinal Database System) was a completely top down usurpation of parental rights to choose the education best for their children via state-invited federal interventions such as No Child Left Behind, Race to the Top, No Child Left Behind Waivers and State Fiscal Stabilization grants.
  • Health Care Reform requires lots and lots and lots of data.
  • Education Reform requires lots and lots and lots of data.
That said, there are those who believe "ObamaCare" was made to be so difficult to navigate in an effort to crash America's current health care system.  The thought here is that if it becomes too hard to get health insurance, the public will clamor for SINGLE PAYER and just let the government handle the whole ball of wax - none of these silly exchanges - no, we'll just move America over to the same side of the abacus as England and Canada and nationalize health care.  After all, we're of socialist stock (eye roll).

I believe this is exactly what is happening to public education in America today when I look at the recent history of education 'reform'.
  • First; you claim America education is failing.
  • Second; from the start, you act as the hand of benevolence by reaching out to states in their time of monetary need with 'free' money to keep education programs running (State Fiscal Stabilization Funds) where you hook states into a four pillared education reform system that includes national standards and state longitudinal databases.
  • Third; you play on America's competitive spirit by offering states a grant where you can Race to the Top of education accountability and results, providing money through a program that continues to perpetuate the four pillars of education reform.
  • Fourth; you do NOT re-authorize the existing ESEA, but instead, go around Congress completely to create waivers for the worst parts of the law (such as the part where ALL children must be 'proficient' in English/LA and Math by 2014).  This, in essences creates your own ala cart law menu that keeps states hooked into the all-important four pillars, but also adds something called "accountability measures" for schools such as Third Grade Reading Retention programs, A-F grading scales and teacher accountability measures.
  • Fifth; you spend 6 years selling the plan to legislators while managing the whole scheme from behind the curtain of private, non-profit organizations within which taxpayers have no representation, propping up the system with huge infusions of cash from the Bill and Melinda Gates Foundation and big business such as Exxon/Mobile and 'happy to help' players such as the US Chamber of Commerce.
  • Sixth; after you have states on their nationalized educational track through your promoted "pillars", you scare states into keeping all their 'accountability' measures by threatening their Title 1 funding.  Though states/districts have no idea what will really happen to them if they don't go along, states take the waivers and in exacting the instructions, districts self-destruct trying to figure out how to keep pressing the bar for their money like a lab rat for its pellet. *Teachers are afraid of having test scores held against them to the point of losing their jobs so they turn on administration.  *Administrators turn on parents who are told they must implement 'reform' measures and that they can't opt out of state tests the A-F grading system utilizes scores to create school grades (page 9) without forcing complete ruination of their school; 
  • Schools are expected to test 100 percent of eligible students enrolled in that school during the testing window for every OSTP exam for which they are eligible, regardless of FAY status. 
  • Schools that do not test a sufficient percentage of eligible students will be penalized as follows (all percentages are rounded to the nearest whole number): 
  • The school’s Overall Letter Grade will be reduced by one whole letter grade if fewer than 95 percent of all eligible test records have valid scores. 
  • The school’s Overall Letter Grade will automatically be reduced to an “F” if fewer than 90 percent of all eligible test records have valid scores.

  • Seventh; you collect lots and lots of data by digitizing the Common Core State Standards states had to take to get an RTT or Waiver, then, you pay two testing "consortia" to create digital online test questions that will align so perfectly that everyone who looks at the scores will be able to tell which standard the students got right and wrong on their exam.  Since we so admire the European system of everything including schooling, can't you believe this will imagine an end result that sounds like, "Sorry Johnny, you can't be an engineer because you missed several math-related test questions indicating you are not engineer material."  You also collect all kinds of miscellaneous data for federal programming such as the "Safe and Drug Free Schools" that includes very detailed information on discipline incidents (that, by the way, don't just fall off the internet when your child needs a clean record for college and career applications!).  You then use this information against schools when they decide they are dumb enough to come crawling back for more money and or 'waivers' from existing unconstitutional federal education laws to further put the screws on them to get what you want.
Unfortunately, we are now so fully entrenched in the idea that the federal Department of Education has power over the states that the Secretary of Education seems to believe it too - pulling Washington state's NCLB waiver as though he had the power to create a waiver from existing law in the first place - as though he wasn't somehow picking and choosing among states to beat first with his government stick.  

Until enough participants in the House and Senate decide they've had enough of unconstitutional government, this won't change soon.  Maybe that's why homeschool is growing by leaps and bounds.

2.11.2014

The Oklahoma Chamber of Commerce Makes "Outrageously Wrong" Claims About COMMON CORE

Recently, the Oklahoma State Chamber of Commerce produced a brochure called, "Preparing Students for Success"


Please note the blue square in the bottom of page 2 which says, "Case Study".  This is a case study on Kentucky.  Here, the Chamber of Commerce gives us the exciting CLAIM that Kentucky's educational scores have risen dramatically since the Common Core State Standards were fully implemented in Kentucky.  

After just one year, the percentage of Kentucky students graduating college and career ready increased from 34 percent to 47%, and for the first time, the state scored above the national average on national tests, including the ACT.
Having at least a working knowledge of statistics, I KNOW there is no way to extrapolate (let alone determine) any correlation among something as diffuse as standards (or curricula) and educational achievement on national tests in one year's time.  There are simply too many moving parts - too many outside factors involved - to be able to attribute any increase (or decrease for that matter) of testing scores to a change in standards made across an entire K-12 system in one year.  Without a degree in statistics (knowing what happened to the OU statisticians who critiqued Oklahoma's A-F system) I felt unable to address this claim outright.

After hearing this brochure was being handed out to legislators at the Capitol, however, I decided to do some research on the Chamber of Commerce claims, so I called Richard Innes, Education Analyst at the Bluegrass Institute in Kentucky.  Richard is also a member of Truth in American Education - an organization for which ROPE is a contributor.

Richard wrote me the following email to share widely.  He is NOT happy about the claims made by the Oklahoma Chamber of Commerce (and, coincidentally, Stand For Children).


Mr. Innes writes: 

Jenni,

For starters, the chamber's assertion about testing results -- that Kentucky scored above the national average on the ACT -- is absolutely false! In fact, this claim is outrageously wrong.


The 2013 ACT results for all states are readily available here: http://act.org/newsroom/data/2013/states.html

Kentucky's ACT Composite Score in 2013 was 19.6. The national average was 20.9.

You have access to the NAEP maps to discuss the claim that Kentucky outscored the nation relative to that assessment, and I have more on NAEP below, as well.

Next, the chamber's pamphlet also contains significant errors about Kentucky's College and/or Career Ready statistics (CCR). The CCR rate didn't increase from 34% to 47% in one year. 

Here are the actual Kentucky CCR rates by year:
 
Kentucky's College and/or Career Ready Rates, by Year

CCR_2010
CCR_2011
CCR_2012
CCR_2013
34
38
47.2
54.1

Data Source: Excel Spreadsheet on CCR in the Kentucky School Report Cards web site (http://applications.education.ky.gov/src/DataSets.aspx). Go to the web address and click on "CCR" under the "Delivery Targets" section. Next, open the Excel spreadsheet and scroll all the way down to the state data at the bottom. The second to last line shows the actual statewide CCR "scores" which really are the percentages. 


The one-year increase from 2012 to 2013 was only 6.9 points!

I am still researching the real implications of the numbers in the table above. At this point I suspect that the growth in 2012 and 2013 is notably due to changes in the state accountability system that started in the 2011-12 school year, including CCR as an accountability element for the first time and creating a number of new ways students could be counted in the success column.

Here the different ways a student can be listed as college and/or career ready:
The College Ready indicator includes graduates who met the Kentucky Council on Postsecondary Education (CPE) system wide Benchmarks for Reading (20), English (18), and Mathematics (19) on any administration of the ACT. Students also are counted college ready if they passed a college placement test (Compass or The Kentucky Online Testing (KYOTE) placement testing system).

The Career Ready indicator includes graduates who met benchmarks for Career Ready Academic (ASVAB or ACT WorkKeys) and Career Ready Technical (Passed the KY Occupational Skills Standards Assessment [KOSSA] or received an Industry-Recognized Career Certificate). Students must pass an element in both areas, academic and technical, to be counted as career ready.
Source: Kentucky School Report Card, State, “Accountability – College and Career Readiness (CCR), from PDF version, Page 36.
The key here is that Kentucky schools probably are still adjusting to the fact that they can qualify students as either college or career ready in more than one way. Some, perhaps a great deal, of the growth in the CCR numbers might be due to more students having the opportunity to take the alternate readiness elements that were not formerly used for accountability and may not have been widely available to students before accountability began. At this point, I cannot say for sure.

What I do know is that the growth in CCR between 2010 and 2013 shown in the table above is not reflected in any notable increase in performance on the ACT college entrance test in Kentucky. 

Throughout the period from 2010 to 2013, all Kentucky public school students have taken the ACT. Unfortunately, the public school Benchmark results have not been consistently reported over this four-year period because Kentucky switched from using ACT's own Benchmark scores to using different Benchmark Scores set by the Kentucky Council on Postsecondary Education (CPE).

However, here are the percentages of all Kentucky students, public and private combined, who have achieved the ACT Benchmark Scores by year. Because private school enrollment in Kentucky is fairly low, the numbers largely reflect the trend for the public schools only.

ACT Performance for Kentucky by Year, All Students Public & Private, Percent of Students Reaching ACT Benchmarks

Year
English
Math
Reading
Science
2010
55
28
40
21
2011
57
28
43
21
2012
59
31
44
22
2013
57
30
36
28


As you can see, there have been no remarkable changes in Kentucky over this four-year period. Reading performance actually dropped in 2013 and science jumped up a bit, but that may be because ACT reset benchmark thresholds for those subjects in 2013. If the reading Benchmark score had not changed, I calculate the percentage reaching the old benchmark in 2013 would be 44, unchanged from the 2012 level. In science, the 2013 percentage would be 23 percent, little different from previous years, as well.

However, the main point is there has been no notable jump in Kentucky for college readiness based on the ACT.

So, there is evidence that the CCR improvement is mostly due to other factors that can lead to a student succeeding in meeting one of the various CCR criteria.

Another point: I led you to the Bluegrass institute's blog (www.bipps.org/blog). We have a large number of posts about Kentucky's true educational performance there, including discussions about why you must look at scores disaggregated by race to begin to properly rank Kentucky against other states. That is true whether we use the National Assessment of Educational Progress (NAEP) or the ACT (only possible for those states that also test around 100% of their students with this college entrance test). 

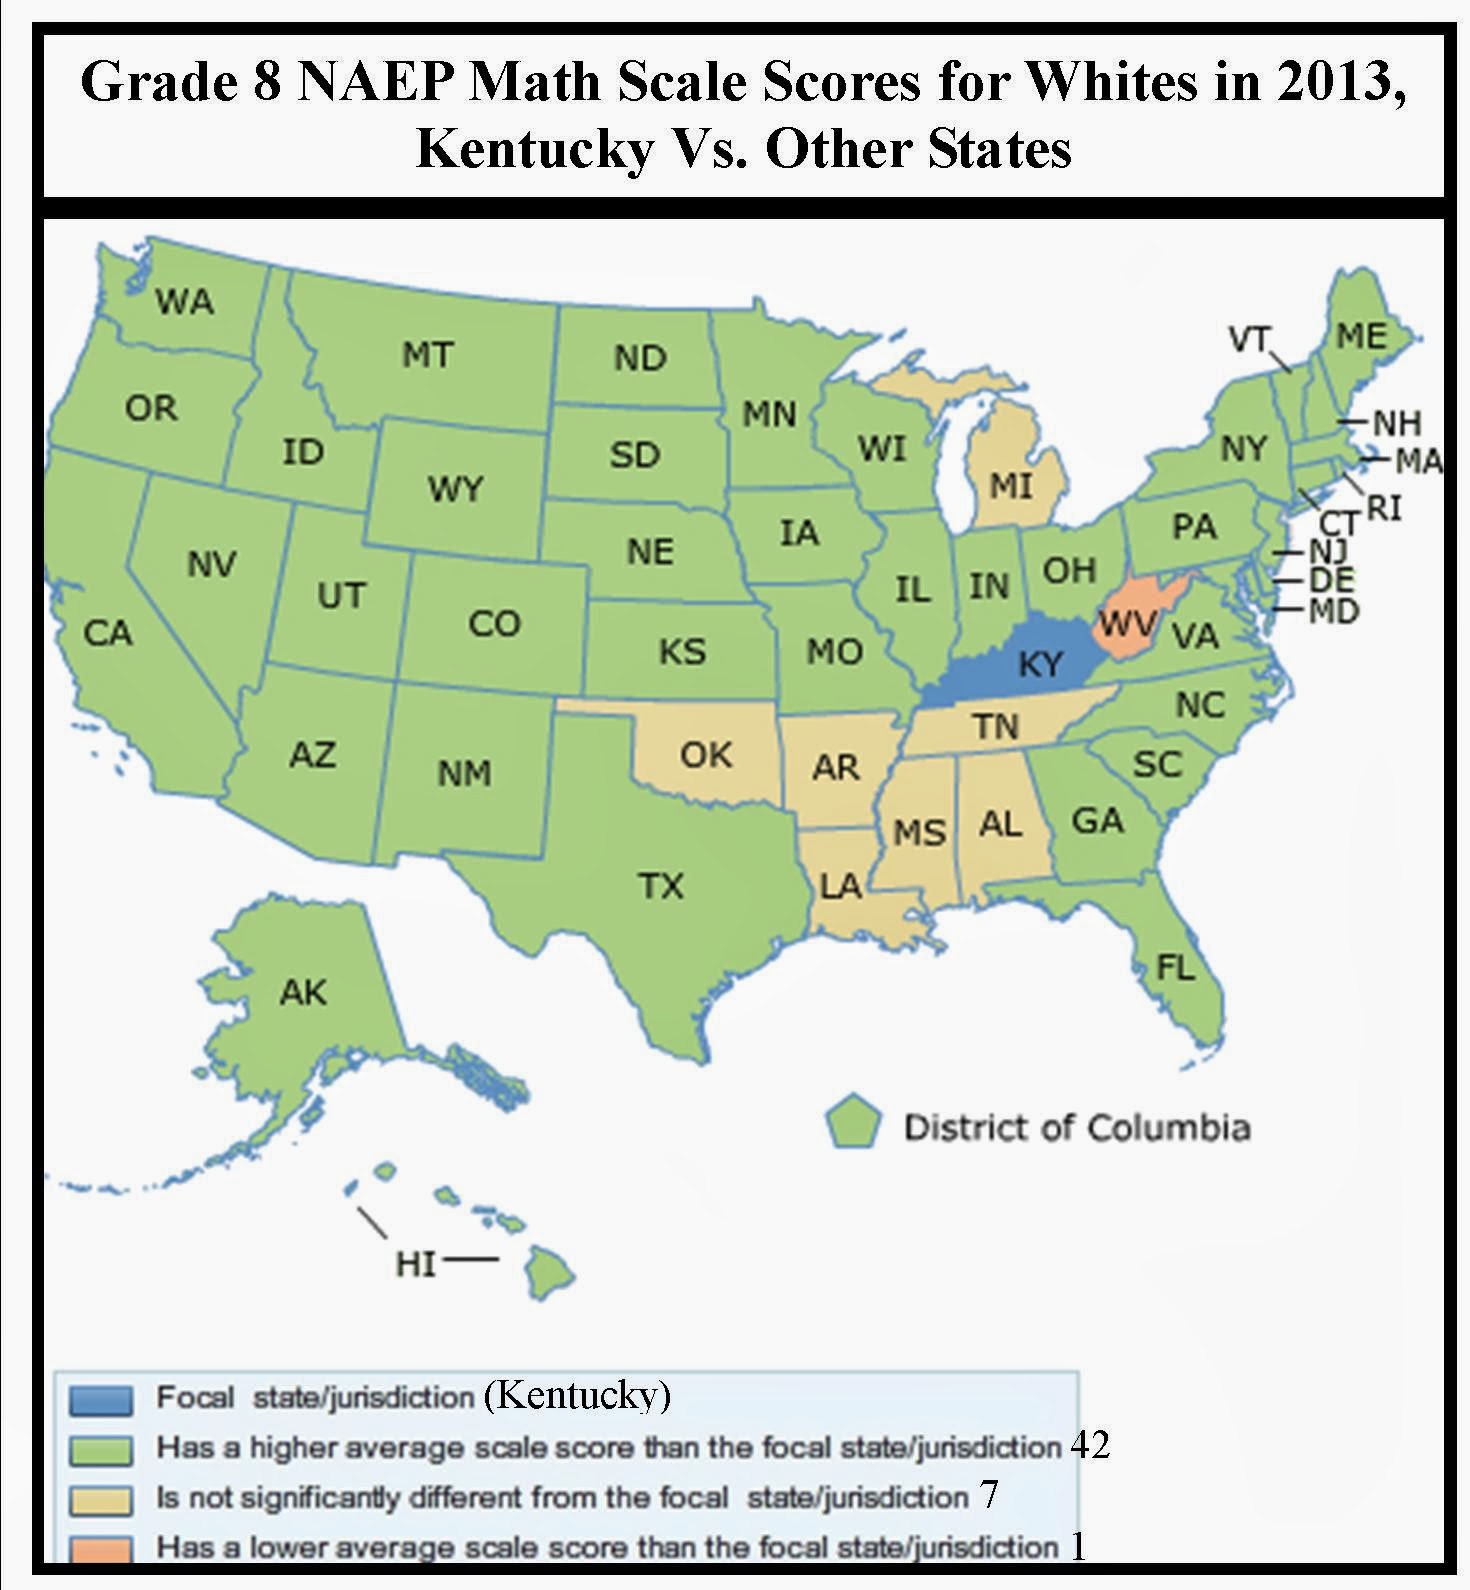
Here is one example of what happens when we disaggregate NAEP performance for eighth grade math


Whites in all the states in green got math scores statistically significantly higher than Kentucky's whites did in 2013. The seven states in tan tied us and only one state, West Virginia, did statistically significantly worse. That's all -- just one state. Is this a target for Oklahoma?

There are more maps like this for Grade 8 reading and for 4th grade math and reading in the Bluegrass Policy Blog.

Let me discuss another example. This is for Southern States that test 100 percent of their students on the ACT.


(If you cannot enlarge this with your e-mail reader, you can find this table here:

http://www.bipps.org/act-scores-are-out-how-does-kentucky-compare-to-other-southern-states/)

Notice that Louisiana scored 0.1 point lower than Kentucky when you look at overall scores. However, when you break the data out by race, Louisiana outscored Kentucky for every single racial group and clearly has a somewhat stronger education system. However, this truth is buried in the overall average scores.

So, what happened to that overall score?

The answer is something that even has a name, Simpson's Paradox. It is a hazard in working with averaged data when the underlying student demographics vary dramatically.

Because of the achievement gaps for all the minorities, a state like Kentucky with a very large white population gets an unfair advantage in any simplistic comparison of only overall average scores. This is very important to understand when others point to things like Kentucky's supposedly high ranking in the latest Quality Counts report from Education Week. Quality Counts is largely a popularity contest for current education fad ideas, but it also includes some NAEP scores. However, with one small exception, Quality Counts only looks at overall average scores. They thus trip all over Simpson's Paradox.

In closing, the jury is still very much out on Kentucky's real education performance since CCSS came along, but there already is a disturbing amount of evidence that much of the hoopla about Kentucky's supposed improvement is not on target.

For sure, almost every claim about Kentucky in the Chamber's pamphlet is absolutely incorrect. I would love to know who fed them this nonsense.


Richard Innes
Staff Education Analyst
Bluegrass Institute
Office:  859-344-0406
Cell: 859-466-8198


So, if the Chamber of Commerce (and Stand For Children) is WRONG about Kentucky?  What else are they patently wrong about when discussing Common Core?